
Data Virtualization
Data Visualization Through Virtualization
Engaging the recipient with data analysis outcomes and allowing them to visualize it in different forms can be one of the best ways to get a message across. 3D data virtualization (a means of data visualization) is a process that quickly draws attention to data patterns and interpretations in a way that is not possible by looking at written stats and reports.
It is not surprising with technology advancement that data can be visualized in ways that it was not possible few years back. Methods of data virtualization is advancing at a rapid pace with much advanced means of visualizing tools such as wearable devices such as Oculus Rift (OR) or Samsung Gear VR that provides the ability of visualizing big data. Many researchers look to visualization to support findings of large data-sets.
“Effective data visualization is a key part of the discovery process in the era of “big data”. It is the bridge between the quantitative content of the data and human intuition, and thus an essential component of the scientific path from data into knowledge and understanding” (Donalek, 2014).
Integrating interactive data virtualization that is based on 3D presentations provides researchers and data analysis experts with advanced tools that enables them to visualize, simulate different results and share multiple results, findings and experiences with others within the organization’s intranet or on the Internet.
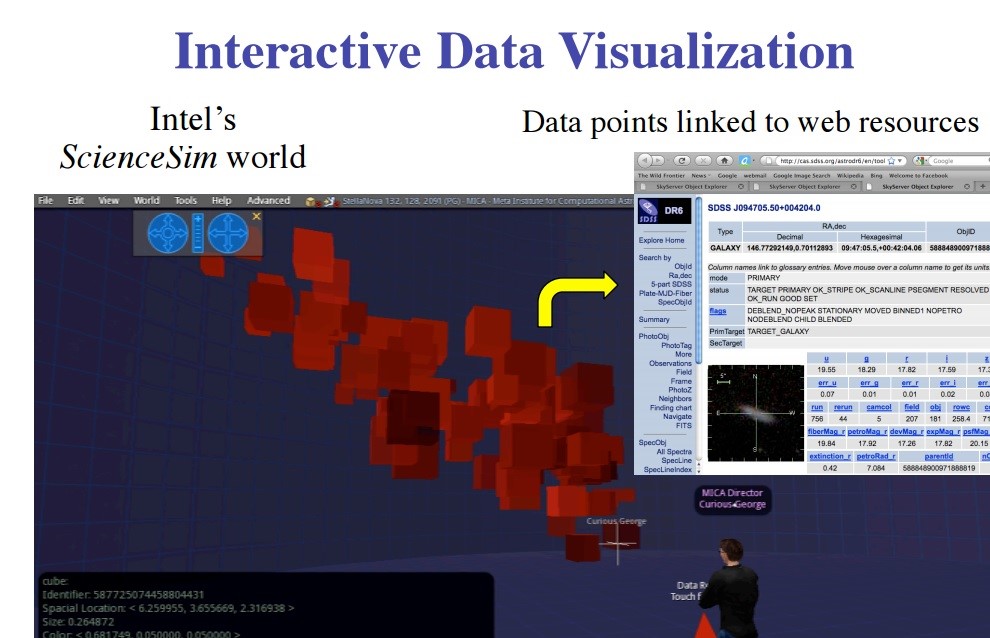
While data virtualization can enhance knowledge and understanding, a balance of blended technologies augments the experiences and understanding. “Thus, a scientist can “walk” into their data, while interacting and collaborating with their colleagues in the same virtual space,” writes Alex Cioc (2014), who is working at Caltech on new data visualization techniques.
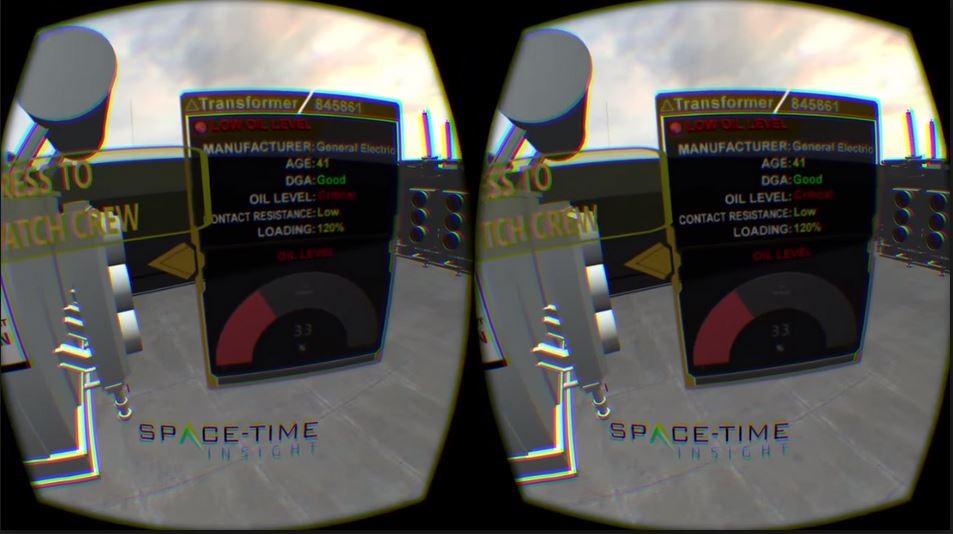
Virtual reality (a form of 3D virtualization) has been shown to increase awareness and the intensity of interactivity. It is vital for data visualization to have a constant and well-planned process that produces accurate results and experiences. A well-developed environment consists of a commensurate design that provides informative and engaging experiences. Virtual reality (VR) can be used to provide simulations in a regulated, safe and flexible platforms that can be used to evaluate data, share experiences and provide training.
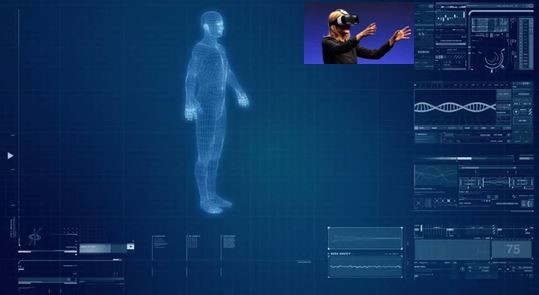
 One of the biggest challenges of big data is obtaining information in a way that the human mind can comprehend. Imagine having the ability to step into your data, the idea is to facilitate the process of visualizing data in a more compassionate way that in return helps humans make better sense and judgment of information and its usability. “Adapters of interactive visualization achieve faster decision making, greater data access, and stronger user engagement, in addition to desirable results in several other metrics” (Krensky, 2014)).
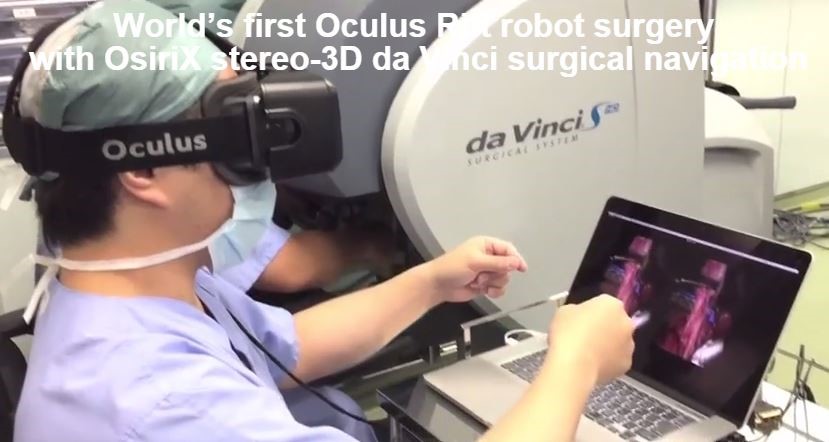
The medical industry are also benefiting from VR. VR use includes data visualization for treatment and data gathering are then used for surgery, rehabilitation and therapy, by the means of blending treatments with immersive virtual reality systems for pain management, behavioral therapy, psychological therapy, physical rehabilitation, motor skills and training. It also involves the use of single and multi-user data visualization for exploration and analysis of data.
As methods of conducting data visualization continue to intensify in a much more disruptive fashion, organizations, data analysis specialist and scientists are able to adapt to these changes, and provide better results that in return benefits the organization. “Good data visualization practices help not just to solve issues but also to pose new questions, encouraging the discovery and research process to go beyond common tasks to explore new patterns and trends that can potentially boost business efficiency” (García, 2014).
Some training may be required on how to use newer visualizing devices. It is true that ease of use of innovative devices is important especially for a first time user. The only concern here is that the first time user may not to want to abandon the new experience.
References
Donalek, et.al. (2014). Immersive and Collaborative Data Visualization Using Virtual Reality Platforms. 2014 IEEE Conference on Big Data.
Cioc, A. in Wheatley, M. (2014) Virtual Reality Brings Big Data Visualization to Life. Silicon Angle Website, http://siliconangle.com/blog/2014/05/29/virtual-reality-brings-big-data-visualization-to-life/
Krensky, P. (2014) Aberdeen Group website http://www.aberdeen.com/research/8847/rr-interactive-data-visualization/content.aspx
García, J. (2014). Data Visualization: When Data Speaks Business. Product Analysis Report IBM Cognos Business Intelligence.